So you want to build a recommender system?
This post originally appeared on the Khan Academy Data Science Blog and talks about some of the work I did during my internship this summer.
Over the years, Khan Academy has built out recommendation engines for several parts of the platform, such as adaptive math ‘Missions’ and SAT practice, but our recommendations never touched one of our main types of content: the videos. For this summer’s Healthy Hackathon, several of us built a video recommendation system for Khan Academy. Using learners’ recent viewing history, we were able to predict what they would want to watch next. At the end of the hackathon, we demoed our model to the company by sending out personalized recommendation emails to all employees, and now we’re starting to test the system on the actual website. This post tells the story of how we got there:
Defining the Problem
Recommendations are everywhere: Netflix knows what you will want to watch next, and Spotify’s new Discover Weekly feature can open your eyes to songs you instantly fall in love with. With this variety of advanced systems comes an overwhelming body of literature, but unfortunately we could not implement all these techniques in four short days. Instead, we decided to focus on a clear and specific question and see how far some simple solutions got us. Our question:
Given the last video a user watched, what video will they want to watch next?
To start, we looked at our users’ video viewing history from the past month. Our model would take in a video a user watched and output several recommended videos. To train and test our system, we organized the viewing history into ordered pairs of videos. Part of these pairs would be used to construct the model; the other part would be used to test it by giving the model the first video in a pair and checking if the second video was one of the recommended output videos. With a clear problem in mind, we explored several approaches:
Model 1: Collaborative Filtering
One popular approach to recommendation systems is collaborative filtering - a method centered around the idea that you will like content similar to other content you’ve viewed. This similarity can be calculated based on other users’ patterns. For example, if many users buy both products A and B, collaborative filtering suggests that these products are related. When predictions are based on binary data, as opposed to ratings, the Slope One family of algorithms can be used. To understand this algorithm, consider the following table where 1 represents that the person saw the video, and a 0 represent that they have not.
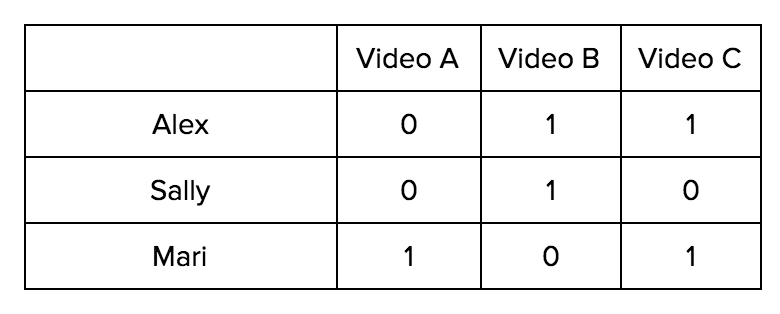
The rows in this table represent whether the user watched a video or not (1 or 0). To get a similarity rating between videos, we take the dot product between the columns. In this example, the dot products are:
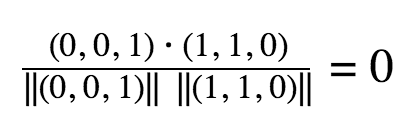
Between video A and B
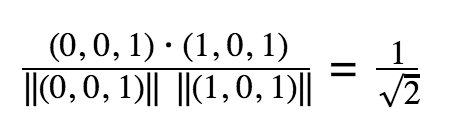
Between video A and C
Between Video B and C
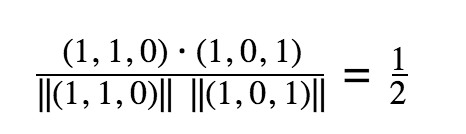
Then, for each video we recommend the video that it had the highest dot product with (other than itself). So, for video A we could recommend Video C, for video B we could recommend C, for C we would recommend video A.
For this approach, we did not use the video pairs during training. Instead we just put a “1” for every video a user had watched during the month as shown in the example above. The model gave us 55% accuracy on the test data; not a bad initial result, as there are thousands of videos to choose recommendations from.
The main weakness of this approach is that it fails to capture one important aspect of our data: the order. While the order in which you buy products or watch movies may not matter, learning has some natural order to it: you can’t learn to add fractions until you’ve mastered adding natural numbers. The Slope One algorithm is agnostic to this property, so we had to search for a new solution.
Model 2: Markov Chains
Looking to capture the order of events, we turned to Markov chains. Markov chains encode the likelihood of transitioning between different states. Here this a simple example from the Wikipedia page:
In this diagram, there are two states A and E. Given that you are in state E, you have a 0.3 chance of staying in state E and a 0.7 chance of going to state A. From state A, you have a 0.6 chance of remaining in state A, and a 0.4 chance of moving to state E.
In our case the states were different videos, and transitions represented watching one video after another. For this model, we recorded all the transitions in the training data. Then, we encoded the probability of transition as the frequency of a given transition divided by total transitions out of that video. For example, if Video A appeared as the first video 10 times in the data, and 7 times the second video was B, then the probability of transitioning to A -> B is 0.7. Using these probabilities, we would pick the most probable transitions to return as recommendations. This approach was particularly appealing for its speed and compactness: once we pre-computed a matrix of transitions, we could quickly pick recommendations for all videos.
The model produced 66% accuracy on the testing data, a solid improvement over the previous model. But the interesting result appeared when we separated our predictions for videos watched on the same day versus different days. The graph says it best:
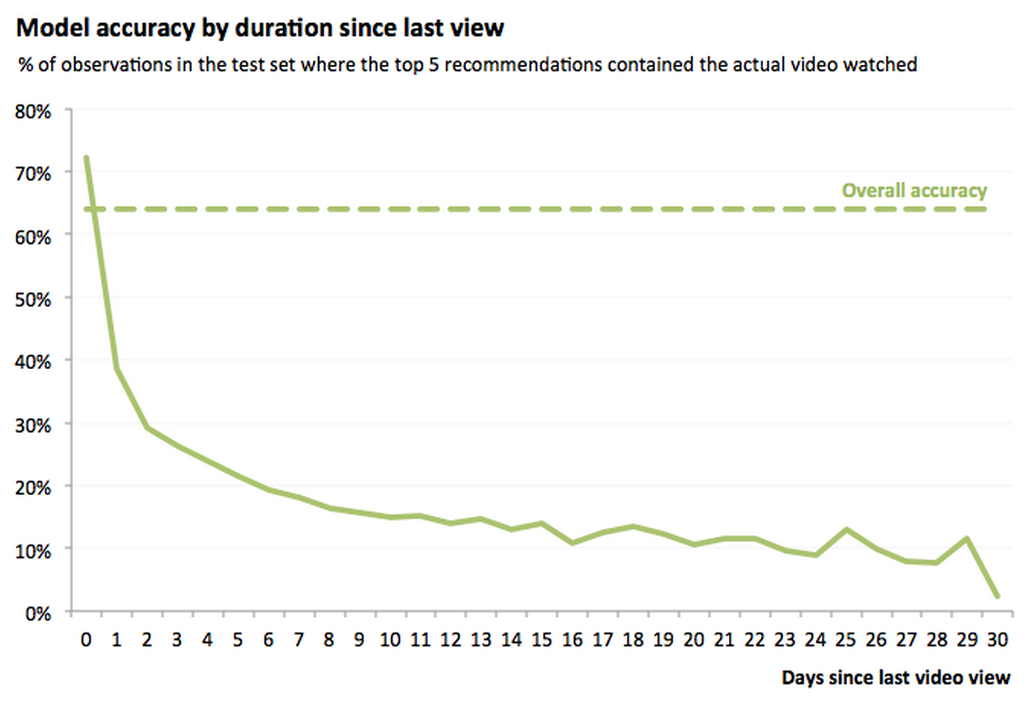
For video views more than a day apart, the accuracy dropped dramatically. This result is not entirely surprising - most of Khan Academy’s content is organized into tutorials: short sequences of related videos and/or exercises.
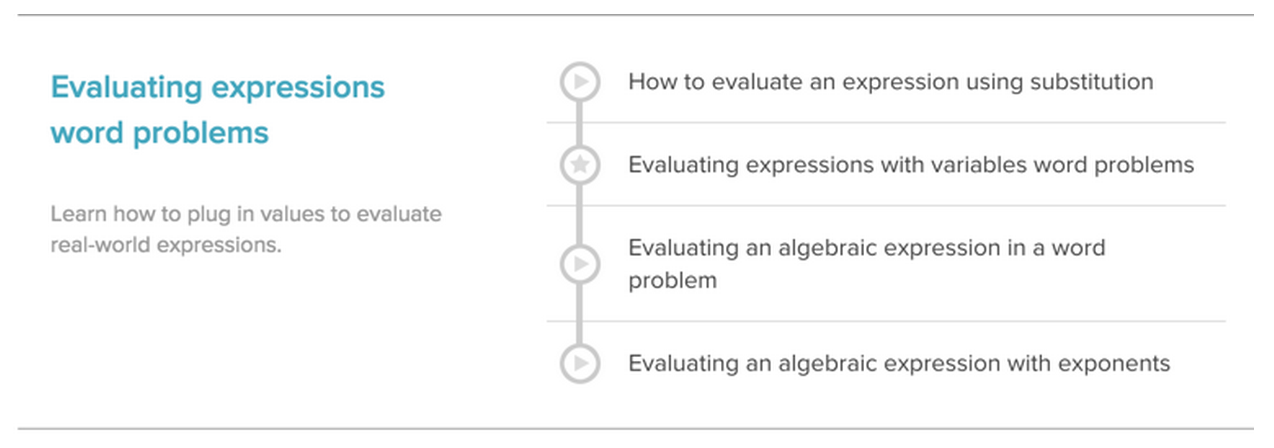
Since the videos in a tutorial are related, students will often watch them in a row. Thus, if a student watched “Evaluating an algebraic expression in a word problem”, it is likely that they will watch “Evaluating an algebraic expression with exponents” on the same day. However, when a student finishes a tutorial or takes several days between watching videos, there are many different places they could go next. Our data showed that the variance in these cases was too large to be captured by the direct transitions.
Model 3: “All-pairs” Markov Chains
Although the direct transitions failed to capture the longer-term viewing patterns, we speculated that these trends may still be present in the data. To explore this idea, we expanded the model to capture all forward transitions for users. If a user watched Video A, then B, then C, we would capture not only the transitions A to B and B to C, but also A to C. The rest of the set-up remained the same. Our accuracy with this model was 62%, a drop from the previous attempt. We suspected that this happened because the additional pairs added noise to previously clear transitions.
Model 4: Markov Model + Time
To find a middle ground between the two previous models, we wanted to incorporate days between video views directly into the model. This dimension would potentially allow us to distinguish between short-term and long-term viewing trends. Unfortunately, in the span of the hackathon, we were not able to fully develop this last model, but in the future it can provide promising results.
Final Models, Results and Thoughts
For the final model, we combined the simple Markov Model (model 2) and the “all-pairs” Markov Model (model 3) with a basic voting scheme, resulting in a 64% accuracy. Although this approach did not account for specific time differences between video views in the prediction, it captured the general order videos were watched in. We decided to combine the two models, instead of just using model 2, because we wanted to keep some of the information about longer term viewing patterns. This decision was motivated by an important insight:
“A good prediction does not a good recommendation make…sometimes.” -Yoda on recommendation systems
Recommendations can serve two main purposes “re-engagement” and “discovery”. Re-engagement means encouraging users to continue using Khan Academy in their learning process; discovery means showing users new content they may be interested in. Increasing the accuracy of predictions can help accomplish the first goal, because it shows how well we capture established trends in the learning process. However, when it comes to discovery, relying on prediction accuracy can fail because discovery is about what could happen, not what already did happen. By incorporating model 3, we started to incorporate this dimension. But in order to fully understand this dimension, we will need to find metrics that capture how student behavior changes with recommendations.
With our recommendation model, we were able to give pretty good answers to the established question: Given the last video a user watched, what video will they want to watch next? and gained a few insights for future models.